| Linear regression |
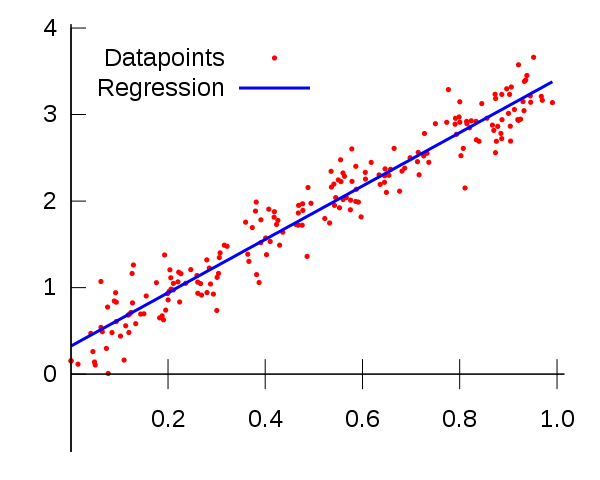
Linear regression refers to a method that determines the average values of the slope and intercept consistent with a given set of data points. The assumed function is linear in form and thus the method fails if the data are not linear. For linear data we need to take the error in the data points into account in order to determine the correlation coefficient, which is the figure of merit that tells us how good the regression is.
Linear regression pdf
Application to a calibration line
One of the most important and general applications of linear regression is the determination of a calibration line. In calibrations the independent variable is a set of given values (uncalibrated) and the dependent variable provides us with the calibrated values.
Understanding the 95% confidence limit for a line pdf
Upper and Lower 95% Confidence Limits
The equations for the "trumpets" are calculated by the worksheet trumpets.
Calculation of regression line with errors
Matrix method for regression
The following slide presentation takes you through the inner workings to the LINEST function in Excel. The presentation shows you the "trendline" approach in Excel first. You should understand that this approach implicitly invokes the LINEST function. To see the inner workings of the LINEST function you can follow along by generating the column vectors and then applying the commands to define and manipulate matrices. To define a matrix you place a rectangle around the area and then give the matrix a name in the upper left hand box. Finally, you will use to complete the operation. The same procedure is used to take the transpose, using the command MTRANSPOSE, to matrix multiply using MMULT etc.
Matrix Approach to Linear Regression pdf
Methods and tools for linear regression
Statistical treatment of chemical data usually involves linear regression or alternatively non-linear fitting of the data. Obviously, linear regression only works if the data is linear. For this reason, numerous methods have been developed to linearize data that is intrinsically non-linear. One example is the linearization of first-order kinetic data. The solution of first-order kinetics is an exponential function
[A] = [A]0exp{ - k t },
where k is the first order rate constant. Taking the logarithm of both sides results in an equation for a line,
log([A]) = log([A]0) - k t.
The a plot of data for log([A]) vs. t gives a slope, k, and an intercept log([A]0). Other linearizations have been made successfully. We will linearize that equations for an adiabatic compression in this course as an example of this procedure. We treat non-linear fitting in a future lecture and computational laboratory. In this lecture and in the associated computer laboratory we will use methods based on LINEST in Excel. These are implemented in an Excel worksheet known as the RLS Macro (see link under methods on the right). As an alterative to this comprehensive worksheet you may use the commands in the LS Command document (see the list of methods on the right). The LS Commands are also quite easy to use and give you a regression line as well as the 95% confidence and prediction curves (above and below the line). We have also called these trumpets as a shorthand name.
Finally, we have an Excel spreadsheet that allows you to use the Dixon's Q-test to determine whether you can eliminate an outlier in your data (see methods on the right).
To use the linear regression in a calibration we need to determine the 95% confidence limit for a horizontal cross-section of the calbiration line.
Calculation of errors of calibration using the trumpets.
Application to absorption spectra
We can view measurement of the absorption spectrum of a series of samples of known concentration as a calibration line with a slope equal to the molar absorptivity. Determination of the molar absorptivity of the d-d and f-f transitions of Cu2+ and Nd3+ is one of the physical chemistry laboratory experiments.
Absorption spectra pdf
The analysis of data at multple wavelengths involves matrix methods. The error analysis of multiple wavelengths involves an application of LINEST to a matrix. This is described in the short presentation.
Matrix regression for UV-vis data pdf
|
|
|
|