| |
 |
|
|
|
| |
| Using FTIR spectroscopy to measure HCl spectra |
| |
The HCl potential energy surface
Hydrogen chloride (HCl) has a ground state dipole moment of 1.08 Debye. Thus, it has a large infrared cross section for absorption as it vibrates along its internuclear bond. In this virtual demonstration, we will review the basics of rotational and vibrational spectroscopy, Fourier transform methods in general, FTIR, and the demonstration itself.
The Assignment
Download the MSWord document and fill in your answers in blue font (for clarity). This document guides you step-by-step, but there are many complementary materials in the Laboratory Protocol. Note that you are also required to turn in the Excel spreadsheet you used make calculations.
Laboratory protocol
Using the Bruker Tensor 22 Fourier transform infrared (FTIR) spectrometer, we have measured a background spectrum using the 10 cm quartz cuvette and add HCl to the cuvette and measure once again. The first meausrement is the reference and the second one can be called the sample. The document below goes through the analysis in some detail. However, we will leave it to the student to take the raw data in Excel and process it to make an absorption spectrum. Then the analysis of the line spacings in the rovibrational spectrum will be used as indicated. Although we show you exactly what to do, you will need to execute the commands and do this in Excel to obtain the needed values. You will also need to calculate the bond length from the measured rotational constant. You have probably done this as an exercise in Physical Chemistry, but if not find the section on rovibrational spectroscopy in the Physical Chemistry text by Atkins and De Paula.
The raw data obtained from the instrument is given in the text file below. There are four columns, 1.) wavenumber, 2.) single beam (empty sample chamber), 3.) 10 cm quartz cuvette (empty), and 4.) quartz cuvette containing HCl. Note that the we only added two drops of HCl to the cuvette and put stoppers in the top. The vapor pressure of HCl produces a high partial pressure of HCl to obtain a high quality spectrum. Also not that the quartz cuvette blocks all light below 2800 cm-1. We can conduct this experiment because HCl rovibrational bands are at a high wavenumber, above 2900 cm-1.
Instructions for analysis
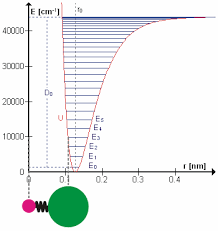
The analysis uses linear regression tools that you have learned in the computational laboratory. In this case you will use linear regression and quadratic regression. The linear regression is used to extract that rotational constant B (in cm-1). The spacing of the rotational lines is 2B. But, the lines are not evenly spaced. There are two reasons for this. One is anharmonicity. In an anharmonic potential (see the small figure above) the lines are more closely spaced, the higher the energy. But, this affects the vibrational transition energy to first order and affects the rotational spacing only to second order. The second reason for a change in rotational line spacing is the centrifugal distortion. In higher rotational states the bond is longer and therefore the moment of inertia is lower.
You will need to plot the data and then make a table in Excel that consists of the number of each rotational peak and its wavenumber. You can do the analysis for both R and P branches, but we will accept an analysis based on the P branch alone. The document giving the details is in the link below. Look in the second half for detailed instructions on the analysis.
Quadratic regression
We have done linear regression since the beginning of the course. By now you are familiar with the idea of having x,y pairs and using the LINEST function to generate a regression. In the simplest case the dependent variable is just the series of integers 1, 2, 3, etc. This is what you will use for the x values in the linear part of the regression on the HCl peaks. When you want to add a qudratic regression to get the second part of the problem, which gives you the centrifugal distortion, you need to set up a second column in the regression with the squares of the integers, 1, 4, 9 etc. This is shown in the pdf in the link below.
History
Diatomic molecular spectroscopy may appear simple in the sense that there is only one vibration, but it is also a rich area for study since the non-harmonic nature of the potential energy surface is readily apparent in the spectroscopic data. Moreover, the bond length changes in the excited state are quite large since all of the electron density difference is concentrated into a single bond. Therefore, the vibrational bands and overtones in ultraviolet spectroscopy are a rich area for study. In this experiment we use infrared spectrosopy to study the rotationial properties, but also the bond force constant, centrifugal disrtortion and the anharmonicity of the molecular potential surface. That is a lot of information from a simple measurement. There are many other diatomics to compare and these have been studied for more than 100 years. The classic book by Herzberg "Spectra of Diatomic Molecules" is a rich source of information. But, a literature search will reveal thousands of publications on diatomic spectra and information that can be extracted from various measurements.
| |
| |
|