| |
| Calibration using Beer's law |
| |
The Beer-Lambert law
The Beer-Lambert law (also commonly known as Beer's law) is one of the most useful chemical equations. The fact that absorption is linearly related to concentration in solution provides a convenient way to measure the concentration of compounds for almost any application. As simple as this relation is, the quantitative application of absorption measurements to determine concentration is best done using a calbiration line.
Transitions of metal ions in metal complexes
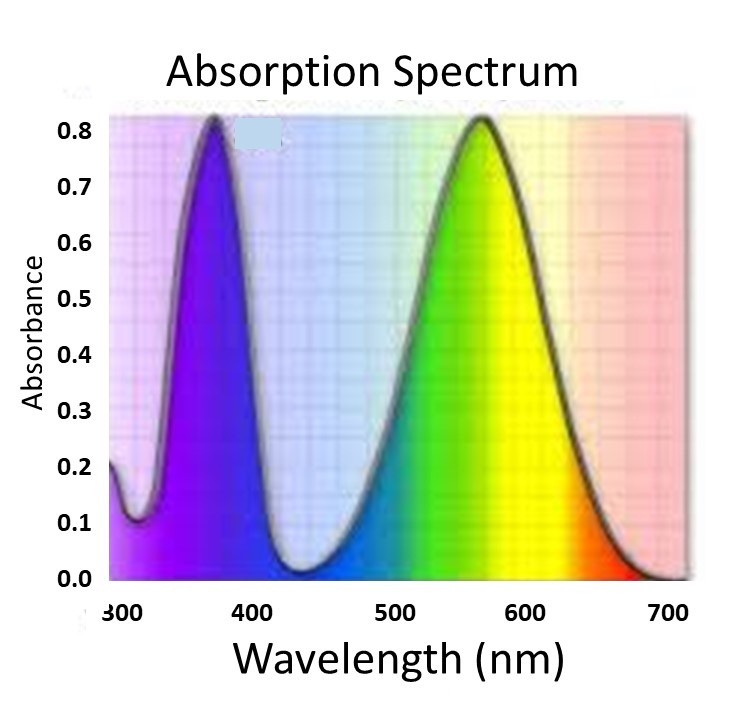
The transitions from d to d in transition metal ions are formally forbidden (so-called LaPorte forbidden) transitions. Therefore, they are typically quite weak. They are also very broad. The reasons for this involve the coupling of the transitions to low frequency modes in the complex and even the solvent due to the mixing of the d orbitals with those of the ligating molecules. Despite their low intensity d-d transitions give rise to the color of many metal solutions. They typical blue color of many copper complexes is an example that we will use in this lab. However, a number of other transition metal ions are also colored (e.g. iron is typically reddish brown, manganese is purple and so on). By contrast, lanthanides have extremely sharp (narrow) f-f transitions. The f-f transitions are also forbidden and are very weak. The narrow line shape arises from the so-called lanthanide contraction, which means that the f orbitals are contracted and therefore their overlap with ligating molecules is very small. The reason for the contraction is the large orbital angular momentum of the f orbitals. As a consequence of the low overlap f-f transitions are very narrow and not dependent on environmental conditions (ligand, solvent etc.). Lanthanide solutions have the interesting property that they appear to be transparent and yet in reality there are numerous narrow absorption bands. Think of the absorption bands as a filter. In the case of the d-d transitions the broad band filters out a swath of wavelengths and if these are in the visible range then the solution appears colored. The lanthanides filter only a small fraction of the wavelengths because the bands are so narrow. Thus, they appear colorless. You will see the large difference between the two types of spectra be measuring the absorption of each of type of ion as a function of concentration. Then you will use the measured calibration lines to determine the concentration of each ion in a solution that contains both ions.
Laboratory protocol
This experiment consists of carefully diluting stock solutions to make a concentration series of two colored metal complexes. The concentration series is used to measure absorbance and make a calibration line. Errors will be important in the analysis of the linear regression since the results will be used to measure the concentration of the complexes in a mixture where they are present in unknown concentration.
Using the Cary UV-vis
The Cary UV-vis is a scanning instrument. You will need to save each spectrum. It is sufficient to scan from 400 to 800 nm. You can then choose the four wavelengths from the laboratory protocol to perform linear regression and obtain the extinction coefficient.
Matrix analysis of the data
One of the important aspects of this lab is to apply the information from two calibration lines simultaneously. The principle behind such an analysis at multiple wavelengths was discussed previously in lecture 3 and computational lab 3 in the section on matrix methods.The setup and implementation of a matrix solution of two or more linear calibrations is shown in the following presentation. Although the example shown uses 4 simultaneous measured calibration lines, you will only have 2. Therefore, your solution will follow the sample procedure, but it will have a different actual form than this example.
If you apply the matrix solution then you will need to use propagation of error for the set of equations.
Since this is quite cumbersome we can recommend a method using multiple regression.
Propagation of error
Multiple regression and error analysis
The link below provides a method for multiple regression and an associated error analysis. First, you must use the calbiration lines at each wavelength and for each ion to determine molar absorptivity.
Further information: practical insights and ideas for lab reports
The link below provides both fundamentals and some information on spectra that may be useful in writing your lab report.
| |
| |
|