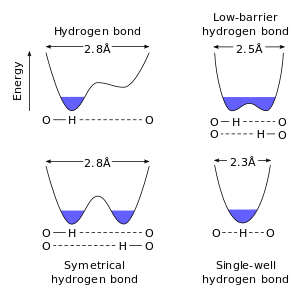
When a donor and acceptor molecule engage in a hydrogen bond the frequency of both groups are alatered because of the electrostatic interaction. Typically the frequency of the bonds within the donor and acceptor are lowered at the expense of a bonding interaction between them, the hydrogen bond. We cannot measure the frequency of the hydrogen bond directly, but rather indirectly from the shifts in frequency of the two partners engaged in the hydrogen bond.
In the projects in this class we have used attenuated total relection (ATR) FTIR spectroscopy to measure the frequencies of hydrogen bondong groups. Using ATR-FTIR has the advantage that there is no sample cell assembly required. FTIR sample cells take practice to use and they are time consuming. The disadvantage of using ATR FTIR is that the solutions are exposed to air and will tend to evaporate. Thus, the measurements must be made quickly. Moreover, high concentrations are required. But, even with these disadvantages students have successfully measured hydrogen bonding complexes and calculated hydrogen bond strengths.
<
- Once you have obtained FTIR spectroscopic data of the carbonyl group of either dimethyl formamide (DMF) or N-methyl acetamide (NNACET) you may compare the calculated frequencies in the DFT calculation files on the right hand column with the experimental data.
- Keep in mind that it is the comparison of the frequencies that is most important. While the actual frequency the carbonyl of DMF may differ from the experimental frequency, the shift in frequency during hydrogen bonding is going to be muc closer to the experimental frequency shift (usually).
- The files on the right are structure files using PDB (Protein Data Bank) format and Density Functional Theory (DFT) output files. The energies are given in several different units and you may use the units most familiar to you.
- The vibrational mode frequencies are given in wavenumbers (cm-1) and are directly comparable to the measured frequencies.
|