| |
 |
|
|
|
| |
| A contained burst of combustion |
| |
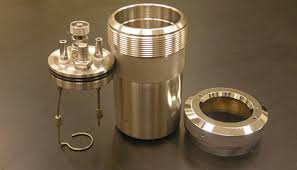
The "bomb" in the bomb calorimeter is shown in the figure on the left. It is a closed container that permits combustion of a sample of known mass under high oxygen pressure. The bomb is submersed in water so that all of the heat released during the combustion process must escape into the water bath. By measuring the temperature increase of the water bath the exact quantity of heat released can be determined. Thus, under constant volume conditions one can obtain the heat of combusion. The remaining issue is to correct the measured number, which corresponds to the internal energy of combustion. Heats of combustion are always tabulated as the enthalpy.
Measurement of temperature
In order to determine the heat released by the reaction inside the "bomb", we need to measure a temperature change in the surrounding water and digitize it for analysis. This can be done using a device known as a thermocouple. A pair of wires made of two different metals will generate a temperature-dependent voltage by an effect known as the thermoelectric effect. This voltage can be registered in digital form using computer software by reading out the converted signal in an analog-to-digital converter (ADC).
Laboratory protocol
This laboratory has simple principle. A combustible solid is placed in a sealed container and ignited under controlled conditions in the presence of excess oxygen. The heat released is captured by the surrounding water bath. Given the known heat capacity of water the measured temperature rise in the water can be used to calculate the total heat released. Thus, one can measure the internal energy of combustion. There are a number of steps that must be done carefully or the experiment will fail. The ignition of the sample is carried out using a current the flows through a wire inside the sealed container (bomb). The wire must make good contact with the leads and with the solid sample. The process of charging the bomb with oxygen is potentially difficult, but the special valve used makes this possible with confidence. The thermocouple needs to be thoroughly immersed in the water and one needs to check carefully that the leads of the thermocouple have not come unwound (i.e. that they have good contact). The thermocouple is homemade so both the hardware and software require some study to make sure that you use it properly. This is good from the point of view of learning. Be sure to ask questions about the thermocouple if anything is not clear about how to calibrate and use it.
Sample data
These data files are provided so that you may obtain better statistics by comparing to the data you have obtained in the laboratory. Please acknowledge the use of these data and make sure to point out which data set is your own work in your report.
Data analysis
The data analysis must account for the possibility that the temperature of the baseline has a slope. For this reason the method involves a regression on a section both before and after the temperature rise due to combustion. Note that you do not need an extremely long range for the determination the lines before and after. An example is shown in the links below. As described in the laboratory manual, you should first determine the lines and then determine the point at which the temperature rise has reached 2/3 of the total. That temperature is the experimental temperature. The total temperature change should be measured at the 2/3 time point. In reality, it should not matter unless the slopes of the baseline and postline are different. That does sometimes happen and this method helps to salvage data in that case.
History
Calorimetry has been used as technique since the experiments of Lavoisier and LaPlace in 1782 using an ice calorimeter. The concept of bomb calorimetry has a long history and has been used to study combustion for well over a century. Today bomb calorimetry is used mostly in food science. Modern calorimetry includes differential scanning calorimetry and isothermal titration calorimetry. But, we should not lose sight of the fact that our huge database of thermodynamic information in tables such as the JANAF tables or sources such as NIST (the National Institute for Standards and Technology) or the CRC (Chemical Rubber Company), come from bomb measurements of the type you will carry out in this laboratory experiment. There are many aspects of this experiment that are worth describing in greater detail and hundreds of references on the use of the method, some of them dating back 100 years or more.
| |
|
|