Ocean acidification
Furthermore, if calcium carbonate
were precipitating in an inorganic ocean the carbonate forming reactions would
be drawn to the right constantly forming hydrogen ions and decreasing the pH unless
there were some mechanism consuming hydrogen ions at the surface. Thus, the pH of the oceans is falling in the
short term. The oceans are becoming more
acidic. The overall reaction is
![]()
For every mole of ![]() that dissolves in the ocean there is an
increase by two equivalents of
that dissolves in the ocean there is an
increase by two equivalents of ![]() in the absence of a mitigating factors. The
important factor to consider it the buffering capacity of the multiple
equilibria of
in the absence of a mitigating factors. The
important factor to consider it the buffering capacity of the multiple
equilibria of ![]() and
and ![]() .
This effect is illustrated in Figure 1.
.
This effect is illustrated in Figure 1.
By Elizajans - Own work, CC BY-SA 4.0,
https://commons.wikimedia.org/w/index.php?curid=79625305
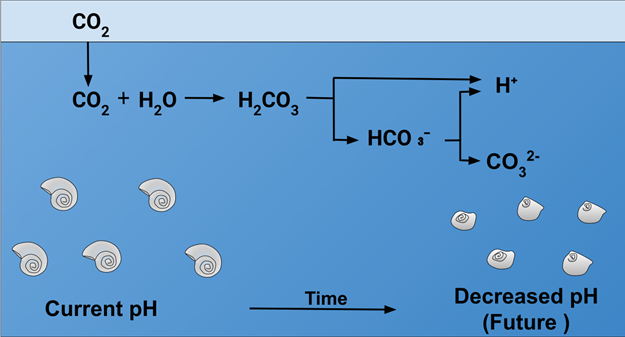
Figure 1 The uptake of CO2
and the two acidic equilibria are shown. The figure also indicates one of the
crucial effects of acidification, which is the loss of stability of the CaCO3
shells of diatoms, forams and other photosynthetic organisms.
Sample calculation of ocean
acidification
Calculate the change in pH if 50%
of the atmospheric CO2 emitted each year were absorbed by the ocean
by the Henry’s law equilibrium for the next 30 years. You may assume that the
change in CO2 is 2 ppm and then use the mass of the atmosphere to
calculate the amount of CO2. The volume of the oceans is 1.347 x 10¹⁸
m3. Assume that the pH of the ocean today is pH = 8.1 and ignore
buffering.
Answer: Since there are
6.5 x 10¹⁶ moles of CO2 in the atmosphere, the amount of
CO2 is in 30 years at a rate of 2 ppm per year is 60 ppm of this
amount or 3.9 x 10¹² moles. The result is the production of two
moles of H+ for each mole of CO2 absorbed from the
atmosphere, which results in 7.8 x 10¹² moles. Given the mass of the ocean the total volume is
1.35 x 10²¹ L. Thus, the new [H+] = 5.78 x 10⁻⁹
M. The current concentration of H+
at pH 8.1 is [H+] = 7.94 x 10⁻⁹ . Thus, the total [H+]
= 1.37 x 10⁻⁸ M. This would give rise to a pH of 7.8. We can compare
this crude calculation to the value given in Table 1, which is pH = 7.95 in the
year 2050. The difference of 0.15 pH units is most likely due to the inclusion
of buffering in the model used in the table.
By Karbonatsystem_Meerwasser_de.svg: User: BeArderivative
Author: Meiyuchang
Public Domain,
https://commons.wikimedia.org/w/index.php?curid=11698714
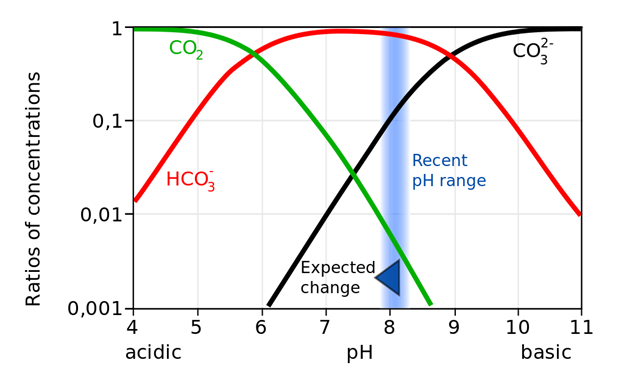
Figure 2 The buffering due to the
amphoteric ion ![]() is shown. The blue swath represents the region
of the pH of the current ocean the predicted change in pH due to CO2
uptake.
is shown. The blue swath represents the region
of the pH of the current ocean the predicted change in pH due to CO2
uptake.
Figure 2 represents the buffering
in the ocean due to the presence of both ![]() and
and ![]() .
As discussed above the concentration of
.
As discussed above the concentration of ![]() is relatively high and the ocean is supersaturated
in
is relatively high and the ocean is supersaturated
in ![]() (aq)
and
(aq)
and ![]() .
The reasons for this are first that riverine fluxes wash
.
The reasons for this are first that riverine fluxes wash ![]() and
and ![]() from surface limestone throughout the world. The
carbon compensation depth (CCD) causes
from surface limestone throughout the world. The
carbon compensation depth (CCD) causes ![]() to redissolve at a depth of ca. 5000 m,
preventing deposits of limestone in the deep ocean. Both the CCD and the
buffering are fortunate from the point of view maintaining ocean pH. If all of
the
to redissolve at a depth of ca. 5000 m,
preventing deposits of limestone in the deep ocean. Both the CCD and the
buffering are fortunate from the point of view maintaining ocean pH. If all of
the ![]() were to precipitate it would immediately cause
the pH of the ocean to fall below pH < 5.0 and cause the death of all life in
the ocean. However, even with the buffering the pH of the ocean has been
falling systematically since the beginning of the industrial revolution in
1800. The result has been a fall in the pH of the ocean pH ~ 8.2 at the dawn of
the industrial revolution to less than pH < 8.1 today. The predicted changes
will have pH ~ 8.0 or even less by 2050 and pH ~ 7.8 by 2100. pH ~ 7.8 is near
a tipping point where the shells of diatoms and forams would dissolve. These
organisms, spread throughout the ocean, produce approximately 40% of the O2
we breathe. Needless to say the tipping point of losing ocean photosynthesis
would be a major threat to many species on land including humans.
were to precipitate it would immediately cause
the pH of the ocean to fall below pH < 5.0 and cause the death of all life in
the ocean. However, even with the buffering the pH of the ocean has been
falling systematically since the beginning of the industrial revolution in
1800. The result has been a fall in the pH of the ocean pH ~ 8.2 at the dawn of
the industrial revolution to less than pH < 8.1 today. The predicted changes
will have pH ~ 8.0 or even less by 2050 and pH ~ 7.8 by 2100. pH ~ 7.8 is near
a tipping point where the shells of diatoms and forams would dissolve. These
organisms, spread throughout the ocean, produce approximately 40% of the O2
we breathe. Needless to say the tipping point of losing ocean photosynthesis
would be a major threat to many species on land including humans.
Table 1.The ocean pH from
pre-industrial times to 2100 are provided based on existing data and modeling.
|
Average surface ocean
pH |
||||
|
Time |
pH |
pH change relative
|
Source |
H+
concentration change |
|
Pre-industrial
(18th century) |
8.179 |
analysed field |
||
|
Recent past (1990s) |
8.104 |
−0.075 |
field |
+ 18.9% |
|
Present levels |
~8.069 |
−0.11 |
field |
+ 28.8% |
|
2050 |
7.949 |
−0.230 |
model |
+ 69.8% |
|
2100 |
7.824 |
−0.355 |
mode |
+ 126.5% |
References
1. Orr, James C.; et al. (2005). "Anthropogenic
ocean acidification over the twenty-first century and its impact on calcifying
organisms" Nature. 437: 681–686
2.
Key, R. M.; Kozyr, A.; Sabine, C. L.; Lee, K.; Wanninkhof,
R.; Bullister, J.; Feely, R. A.; Millero, F.; Mordy, C.; Peng, T.-H. (2004).
"A global ocean carbon climatology: Results from GLODAP". Global
Biogeochemical Cycles. 18
(4): GB4031.
3. Hall-Spencer,
J. M.; Rodolfo-Metalpa, R.; Martin, S.; et al. (July 2008). "Volcanic
carbon dioxide vents show ecosystem effects of ocean acidification". Nature.
454: 96-99