Spectroscopic studies of myoglobin thermodynamics and kinetics
Myoglobin has been
dubbed the “hydrogen atom of biophysics”. It was the first protein crystallized and has been studied by every conceivable physical method. Myoglobin is the protein in muscle that is
responsible for oxygen binding and storage.
It is composed of 8 a-helices in the globular structure shown below. The red, purple or brown color of myoglobin
arises from the heme group, which can exist in two oxidation state, ferrous (Fe2+) and ferric
(Fe3+).
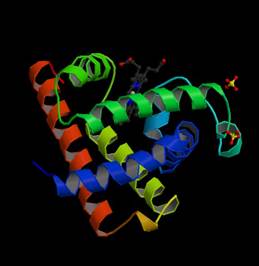
Figure
1. Structure of myoglobin from Sperm Whale.
Ferrous myoglobin can exist in a
ligand bound state (e.g. Fe-O2, Fe-CO, or Fe-NO), or in the deoxy state. Deoxy myoglobin is five-coordinate and the ligand-bound
states are six-coordinate. We are often interested in measuring binding to
myoglobin in the presence of a given partial pressure of a gas. To relate the concentration of the gas in solution
to the pressure we use Henry’s law.
![]()
(1)
where KH
is the Henry’s law constant, which is also the equilibrium constant for gas
solubility. The binding in solution is governed by the interaction of the ligand with iron. The
dissolved CO gas can diffuse into the protein and bind to the iron as shown in
the cryogenic X-ray crystal structures shown in Figure 1.
.1.1 Structural forms of carbonmonoxy
myoglobin
Figure
2 was obtained at 20 K where the protein is
sufficiently rigid that the CO cannot escape.
However, the CO can be photolyzed, which means
that the Fe-CO bond is broken by laser irradiation. Specifically, the heme
group can be photoexcited in resonance with its p-p* transition, as shown in Figure 4 where
the absorption spectra of two forms of the heme group
are shown. The bound form of CO is called MbCO, shown in Figure 2
as the red form of the protein. The photolyzed form, Mb:CO,
is shown as the purple form in Figure 2.
The deoxy form is
crystallized without any CO and is shown as the blue form.
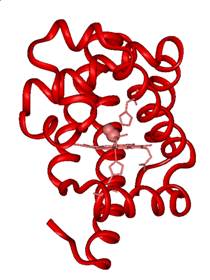
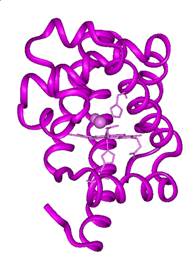
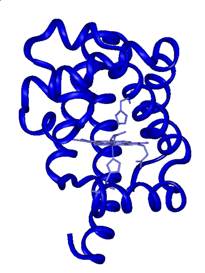
Figure 2. Cryogenic X-ray
crystallographic structures of MbCO (red), Mb:CO (purple) and Mb + CO (blue).
The three forms are shown superimposed in Figure 3. Figure 3 also shows an expanded view of the
pocket where CO binds to the heme iron. One can see that the CO begins to move away
from the Fe atom once the bond is broken (purple structure).
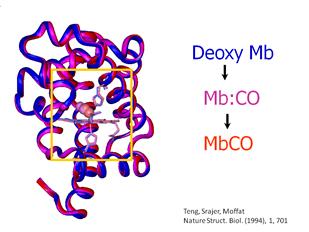
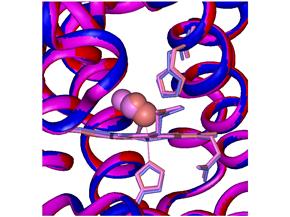
Figure 3. Superimposed cryogenic forms of myoglobin combined with the diatomic
molecule CO.
1. Spectroscopy of the heme group in
myoglobin
The
heme group in myoglobin is a useful probe of the
state of the protein. Figure 4 shows that the carbonmonoxy (CO)
form and has a different spectrum than the deoxy
form. The figure shows that there are
intense B bands and weak Q bands for both forms. The reason for these two types of electronic
transitions can be found in the simple
particle-on-a-circle model. In that
model, we have shown that the energy levels of the porphyrin can be modeled
using an 18-electron p-system shown in
Figure 5. Starting with the energy
levels of the particle-on-a-circle given by the Schrödinger equation,
![]()
(.1.2)
We have the normalized solutions
![]()
(.1.3)
where
![]()
Figure 5 shows us the meaning of
these quantum numbers. They refer to
whether the electron is travel clockwise m > 0 or counter-clockwise m < 0
around the circle. Moreover, we can
understand the selection rule based on our study of the interaction of electric
fields with matter. The electric fields
polarized along x- and y- are
![]()
![]()
(4)
Thus, a transition dipole moment
operator that connects two states under the influence of the electric field
also has the form
![]()
![]()
(5)
where e is
the charge on the electron. Only if the
transition dipole moment is non-zero will the electric field be able to
interact with the molecule. For example,
the x-polarized transition dipole moment is
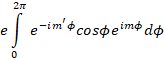 (6)
(6)
Where m and m’ are different
quantum numbers. We see from Eqn. .1.5 that we can write this as
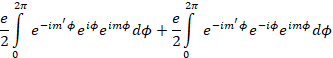
(7)
The condition for the integrals to
be non-zero are
![]()
![]()
or
![]()
This condition or selection rule is shown in Figure 5.
It is also shown that the number m corresponds
to the number of nodes in the wave function when a more advanced molecular
orbital picture is applied to understand the spectroscopy. It turns out that any level of quantum theory
predicts that the ground state of heme (or any
porphyrin) consists of two states that are so close in energy that they act as
thought they were degenerate. These are
shown a1u and a2u in Figure .5. The excited state is a rigorously degenerate eg set of levels. Putting these together gives two
possibilities for the p-p*
transition. There are two transition
moments (M1 and M2 in Figure 5) that can add
constructively, M1 + M2, to give the intense B band or
destructively, M1 - M2, to give the weak Q band. Both the B band and the Q band provide a
means to monitor changes in the ligation state of the heme
iron. Figure .5 shows that the
difference in the CO-bound form MbCO and the deoxy form Mb is significant. We can use these spectral differences to
monitor the rebinding of CO heme proteins. This is a spectral probe of
ligand dynamics that also teaches us about protein dynamic motions.
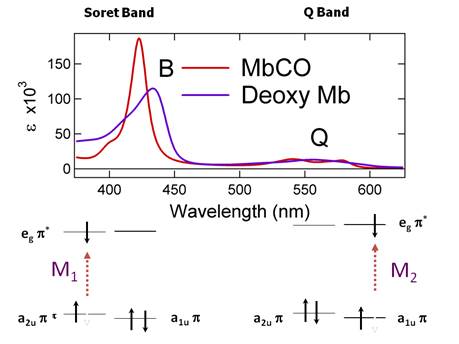
Figure
3. Soret (B) and Q absorption bands for heme. The energy
level
scheme for heme is shown
below. There are two
transitions that can
add constructively or destructively.
When comparing the free electron
model we note that there is a “forbidden transition” with Dm = 9 that is
predicted by the particle-on-a-circle or free electron model. The Q-band is this forbidden transition. Since the Q-band is
observed, there must a mechanism that makes the forbidden transition
allowed. We can this mechanism vibronic coupling.
Distortions along normal modes of vibration can lower the symmetry of
the molecule and permit a weak, but still observable band in this region. It is worth noting that when the metal has no
spin contribution, the change in the orbital angular momentum of the Q-band is
9 times larger than that for the Soret band. This means that the simple free electron
theory correctly predicts the magnetic behavior of this band.
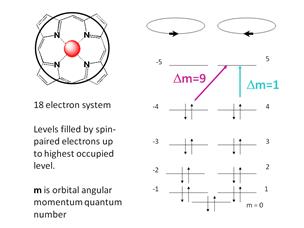
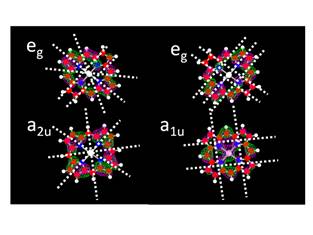
Figure .5. Comparison of the free
electron model with a full quantum chemical calculation of the molecular
orbitals of the HOMO (p) and LUMO (p*) orbitals of heme.
.1.3 Kinetics of myoglobin
The kinetics of CO
recombination have been studied using flash photolysis. Once the Fe-CO bond is broken, the CO can
migrate out of the pocket shown in Figure 3.
At room temperature the CO can escape into the
solvent. Thus, there are two possible
pathways for the -CO to recombine with the iron. There is a geminate pathway (direct
recombination from within the protein), and a bimolecular pathway, which
involves migration back into the pocket.
The kinetic scheme,
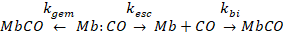
(8)
An approximate solution of the rate
equations leads to the time course for the disappearance of the deoxy Mb form following photolysis.
![]()
(9)
where the
prime indicates that this is a pseudo-first-order rate constant, ![]() . If the experiment is done under conditions
where [CO] is in excess in solution, we can ignore any changes in [CO]
concentration. Under these conditions we can follow both the geminate phase on the
nanosecond to microsecond time scale and the bimolecular phase on the
millisecond to second time scale as shown in Figure .7.
. If the experiment is done under conditions
where [CO] is in excess in solution, we can ignore any changes in [CO]
concentration. Under these conditions we can follow both the geminate phase on the
nanosecond to microsecond time scale and the bimolecular phase on the
millisecond to second time scale as shown in Figure .7.
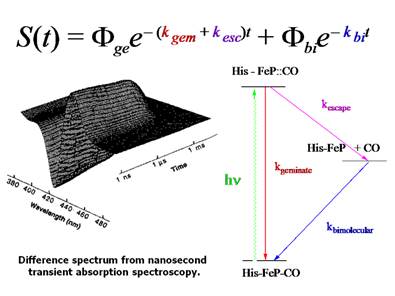
Figure 5. Kinetic scheme for CO photolysis and recombination
in myoglobin.
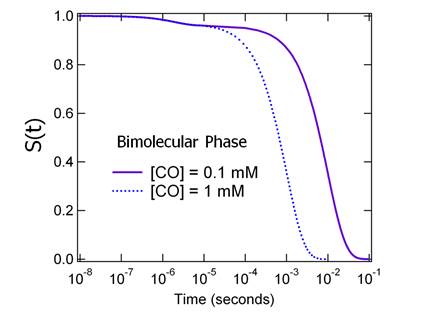
Figure
6. MbCO recombination kinetics.
The factors that control the
geminate process include the iron spin state and geometry in the heme iron. For
example, for MbCO the iron is six-coordinate and low
spin (S = 0). When the CO is photolyzed the iron becomes five-coordinate and high spin
(S = 2). The change in spin state
correlates with a change geometry. The
iron is large in radius when the electrons are unpaired and the result is that
iron no longer fits in the center of the heme
porphyrin ring the S = 2 state.
Consequently, the iron moves out of the plane as shown in Figure .8.
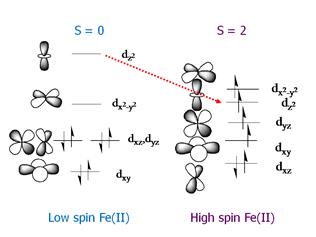
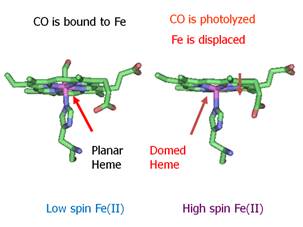 Figure
7. Correlation of spin state with structure in heme
complexes.
Figure
7. Correlation of spin state with structure in heme
complexes.
The recombination of CO with the
iron is thermodynamically favored, but is kinetically rather slow because of
the requirement for a change of spin state.
Figure .9 shows the calculated MbCO (S = 0)
and deoxy Mb + CO (S = 2) states. There is a barrier at the intersection.
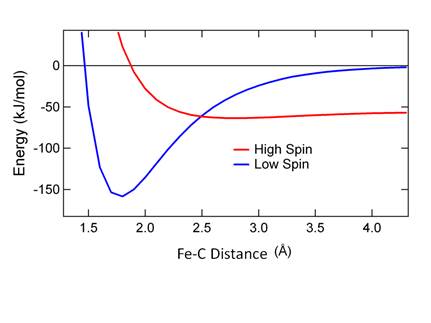
Figure
8. Potential energy surfaces for MbCO recombination.
.1.4 The H93G cavity mutant
There
are literally hundreds of biophysical studies of myoglobin. The kinetics of myoglobin has
been studied as an example of protein dynamics. One aspect is the recombination kinetics of photolyzed CO at low temperature or high viscosity. Under these conditions
the recombination becomes non-single-exponential. We have seen that first order kinetics are
single exponential. However, more complex kinetic decays are often observed experimentally. What does it mean if a kinetic time course is
not single exponential? One possible interpretation is that there are
multiple intermediates in a sequential pathway.
We have already discussed the case one intermediate (see section .1.3). We can further consider two intermediates as
shown below.
MbCO à Mb:CO(1) àMb:CO(2) à Mb + CO
As a general rule
the number of exponentials needed to describe such as a system is equal to the
number of intermediates plus one. Here
it would be three exponentials.
Obviously, the time scales for formation of each intermediate would need
to be sufficiently distinct to permit the observation of unique times.
A
second possibility that might give rise to non-exponential kinetics is the
existence of different protein structures.
This idea has been used to suggest that
myoglobin exists in many different conformational states (and even substates) so that non-exponential kinetics represent many
different recombinations with different rate
constants. It was
thought that the iron out-of-plane displacement played a key role in
these states and the associated rate constants.
One
way to test the role of the iron is to use a proximal cavity mutant. Histidine 93 is the amino acid that binds to
the heme iron.
The mutation to glycine abolishes this connection between the heme iron and the protein.
Instead, the protein is grown in E. coli with
an exogenous iron ligand, such as imidazole.
The net effect is a protein shown in Figure .10, which differs from the
wild type only by one carbon atom. The b-carbon that normally connects the imidazole
ring of the histidine to the protein is missing in H93G. This carbon is shown
by the red circle in the Figure .10. It
is evident that the carbon atom is missing in the mutant. The imidazole in the mutant can
be replaced by other imidazoles and even
pyridines or other coordinating ligands that fit into the cavity. The kinetics of three different imidazoles are shown in Figure .10
as well.
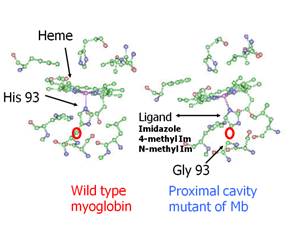
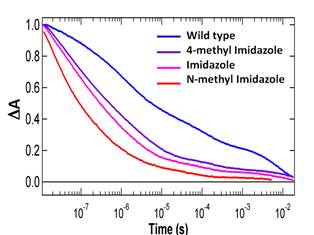
Figure
9. Structure and kinetics of H93G-CO.
One conclusion that can be drawn from the data in Figure .10 is that the
kinetics can change dramatically with no intervention by the protein. The proximal ligand in H93G is not covalently
bound to the protein. Thus, the large
change in kinetics in Figure .10B is not the result of protein control, but
rather a chemical effect that arises from the bonding. The kinetics shown in Figure .10B were
obtained at 250K. This means that the
geminate phase is large. At 250K in 50% glycerol/buffer the protein is frozen and ligand escape
shown in Figure 5 is very limited. The
fact that the kinetics are highly non-exponential in all of these cases would, by itself, seem to indicate that the Fe-control
hypothesis is not the correct one to explain the lack of exponential
kinetics. Rather the kinetics are
probably determined by multiple geometries (conformations), which could arise
from either a parallel or sequential model, as
discussed above.
It
might be objected that the proximal has some kind of
effect on the kinetics on the distal side.
Such a feedback could occur if the geometry on one of the heme were communicated through the
protein structure to the other side. One
can perform a kinetic analysis of the geminate and escape rates from data such
as those shown in Figure .10B to determine whether the escape rates are
affected or mainly the geminate rates (Table 1).
Table 1. Experimental data for the
observed recombination of CO to H93G mutant proteins.
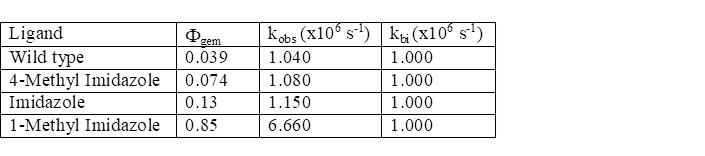
The data in Table 1 were obtained at room temperature. Note that the measured parameters must be
analyzed using Eqn. 9
in order to obtain the intrinsic rate constants, kgem and kesc. The results supported the hypothesis that the
proximal ligand mainly affects the geminate rate. The escape rates showed a modest effect as a
function of the ligand. The analysis of
these rate constants is given as an exercise below.
.1.5 Vibrational spectroscopic studies of MbCO
The
internal environment of the protein can be probed using the infrared stretching
frequency of both Fe-bound and unbound carbonmonoxide
(CO). The Fe-CO adduct has significantly
different properties from free CO. In
the gas phase, the CO stretching frequency is 2143 cm-1. However, just as vibrational mode
frequencies of H2O are shifted in the
liquid because of hydrogen bonding, we observe that CO will have a shifted
frequency when it is trapped in a protein (e.g. 2110 cm-1 – 2135 cm-1). The shift is relatively small compared to
that of water, which is a result of the weaker hydrogen bonding.
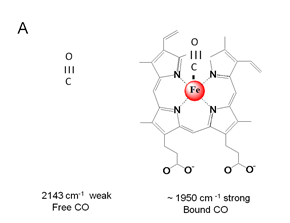

Figure 10. A. Depiction of free and
heme-Fe-bound CO.
B. illustration of the dipole moment of free CO and the effect of p-backbonding
interaction on the dipole moment of bound CO. The p -backbonding interaction strengthens
the Fe-C bond and weakens the C-O bond.
The chemical bond formed when CO
makes and adduct with the heme iron has a profound
effect on both the frequency and the infrared intensity of CO. This is illustrated
in Figure 20. The frequency lowering of
the n(C-O) stretching vibration shown
in Figure 10A is due to the fact that the Fe-dxz,yz
orbitals add electron density to the p* orbital of the CO. Thus, the strengthening of the Fe-C bond
occurs at the expense of the C-O bond.
This shift is observed in all heme proteins,
but the magnitude of the shift depends on the nature of the trans
bonding to the heme Fe atom. The values of n(C-O)
range from 1910 cm-1 to 1980 cm-1 depending on the
proximal ligand and on the nature of distal interactions. The distal interactions can
be thought of as hydrogen bonding between amino acids the bound CO
molecule. These interactions too will
have an effect that can be as large as the proximal effect. Such effects can be studied
selectively by site-directed mutagenesis of the distal pocket as shown in
Figure 11.
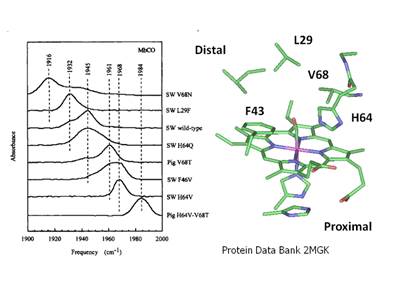
Figure 11. The effect of
site-specific mutations on the frequency of Fe-CO in Sperm Whale
myoglobin. Note that the frequency of
the n(C-O) stretching band ranges from 1916 cm-1 to 1984 cm-1. Depending on its hydrogen
bonding environment.
The
effect of bonding can be seen as an effect on the
force constant. Since the reduced mass
is constant for the entire series in Figure .12 we can study the effect of the
hydrogen bonding as the effect of an applied electric field on the vibrational
frequency, a so-called vibrational Stark effect. This type of effect provides information on
the conformations of heme proteins and particularly, it is the effect near the active site that is most
relevant.
The
infrared absorption intensity of the CO is increased
by nearly a factor of 20 when it is bound to the heme
iron. We can understand this as an
increase in the ground state dipole moment, m. If m
is larger then the infrared transition moment, which
is proportional to ![]() will also be larger. The increase in dipole moment comes about
because of the additional effect of the electron density from the Fe atom. We can estimate m in the bound state based on the additional charge injected by
the heme iron.
This effect is observed experimentally in low
temperature infrared difference spectra shown in Figure 11. In the experiment shown in Figure .13 the
sample is cooled to below 20 K. Then an infrared spectrum is
taken. Subequently
the sample is irradiated to photolyze
CO. A second infrared spectrum is taken, and the first spectrum is subtracted from the
second to create a difference spectrum.
In the difference spectrum, any bound CO will appear as a negative band
and any photolyzed CO will appear as a positive
band. We see in the Figure that the
intensity of the negative band (corresponding to Fe-C-O) is nearly 20 times
larger than that of the positive band (corresponding to photolyzed
CO trapped in the protein).
will also be larger. The increase in dipole moment comes about
because of the additional effect of the electron density from the Fe atom. We can estimate m in the bound state based on the additional charge injected by
the heme iron.
This effect is observed experimentally in low
temperature infrared difference spectra shown in Figure 11. In the experiment shown in Figure .13 the
sample is cooled to below 20 K. Then an infrared spectrum is
taken. Subequently
the sample is irradiated to photolyze
CO. A second infrared spectrum is taken, and the first spectrum is subtracted from the
second to create a difference spectrum.
In the difference spectrum, any bound CO will appear as a negative band
and any photolyzed CO will appear as a positive
band. We see in the Figure that the
intensity of the negative band (corresponding to Fe-C-O) is nearly 20 times
larger than that of the positive band (corresponding to photolyzed
CO trapped in the protein).
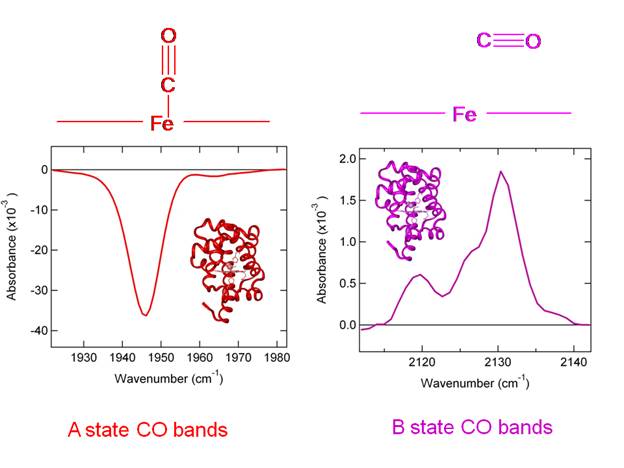
Figure 12. Experimental
evidence for a difference in intensity between bound and free CO. The bound CO species can have multiple
frequencies due to different conformations of the protein, known as A states. Likewise,
the CO bands of free CO trapped in the protein are known
as B states.