Studies of the photosynthetic reaction center
The
photosynthetic reaction center is the protein-pigment complex that converts
light energy from the sun into chemical energy in plants and bacteria. The structure of the bacterial photosynthetic
reaction center was solved by X-ray crystallography,
and represents the first membrane protein structure that was determined. This structure and the organization of the
chromophores is shown in Figure 1. The protein spans the periplasmic membrane
and when combined with the bc1 complex constitutes a light driven proton pump
in the bacterium. The coupling of light
energy to proton uptake and translocation occurs involves the cofactors shown
in Figure 1B. These are the primary
donor, P, the primary acceptor H, the secondary acceptor QA and
finally the removable quinone QB. When the primary donor of photoexcited
to form a singlet state 1P,

(1)
it can
rapidly transfer an electron to the bacteriopheophytin,
H, to create the charge separated state P+H- (t
~ 1 ps).
![]()
(2)
A bacteriopheophytin
(BPheo) is structurally the same as a BChl except that it lacks the central Mg atom. Subsequently, in a slower step the electron
can be further transferred to the quinone QA
to create P+HQA- (t
~ 100 ps).
![]()
(3)
If QB is present (and it
may not be since it can leave the RC) the electron will transfer on to QB
to create P+QB- (t
~ 100 ms).
![]()
(4)
P+QB- can take up a proton to make P+QB- + H+ à
P+QBH. This form
of the RC is inactive, but it is reduced by a
cytochrome c molecule P+QBH + Cyt
c à
PQBH + Cyt c+. Now, the entire series of electron transfers
can proceed again to create a second P+QBH- , which
can take up a second proton
![]()
(5)
Finally, ![]() can leave the RC and migrate to the bc1
complex where its cargo of 2H+ is given the proton
pumping complex. The essence of
the RC’s function is to convert light energy into electrical energy that can be used to capture and translocate protons.
can leave the RC and migrate to the bc1
complex where its cargo of 2H+ is given the proton
pumping complex. The essence of
the RC’s function is to convert light energy into electrical energy that can be used to capture and translocate protons.
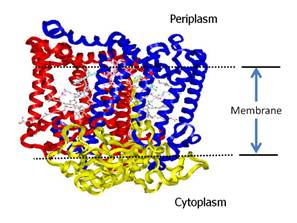
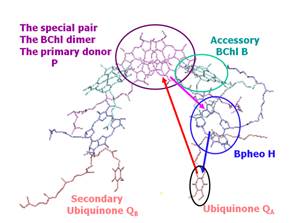
Figure 1. Structure of the
bacterial photosynthetic reaction center (RC) from Rhodopseudomonas sphaeroides.
From a fundamental biophysical
perspective, the electron transfer reaction is the most basic type of
process. There are at
least three electron transfer reactions that are important in the normal function
of the RC. Figure 1B shows that
there can be short circuit back to the starting point if QB is not
present. The charge combination
reaction,
![]()
(6)
Does not occur if QB is
present, but will occur in an isolated RC is QB is removed. This state of the RC is useful since it can
be relatively rapidly reset (t ~ 100 ms). Just like the
example of photolysis of myoglobin, the RC can be studied
by laser photolysis in a manner that permits signal averaging. The rate scheme that describes the cycle of
electron transfers is shown in Figure 2.
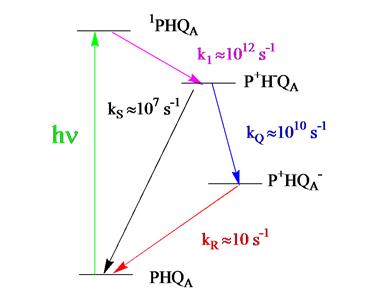
Figure
2 Kinetic scheme for the photosynthetic RC.
Electron transfer theory
Electron
transfer (ET) reactions are the fundamental kind of chemical process that can be studied from a theoretical point of view. The quantum mechanical treatment of ET has
both an electron and a nuclear part, just like absorption of light. However, unlike absorption of light, there is
no input of energy in electron transfer, so the initial state must be higher in
energy than the final state. We call the
energy difference between the states, e,
which is really an enthalpy, DHo
for the reaction. In fact, the entropy, DHo, can be included in the
calculation so that e actually
represents the free energy, DGo. Figure 3 shows that
there is a barrier between the reactants (shown in blue) and products (shown in
red). For example, for a charge
separation reaction the reactants are DA (donor-acceptor) and the products
consist of D+A-. The barrier is determined
by the relationship between the energy gap, e
and the reorganization energy, l. The reorganization energy is equivalent to
the energy required to distort the system from the final geometry to the
initial geometry along the reactants potential surface. We can relate the barrier height e* to the energy gap and reorganization
energy.
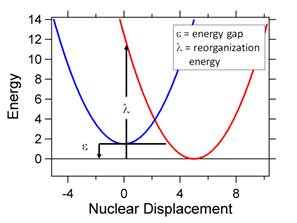
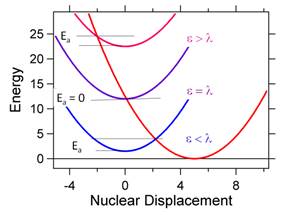
Figure 3. A. The energy gap, e, and reorganization energy, l,
are defined using the potential energy surfaces of the reactants (blue) and
products (red) as a reference. B. Three
different cases with different geometries are shown
for the reactant and product surfaces.
Depending on the relative values of e
and l, the activation energy, e*, can be zero (activationless)
or positive (either e < l or e
> l).
The energy barrier, ![]() ,
which is also the activation energy, is derived in Appendix B.
,
which is also the activation energy, is derived in Appendix B.
![]()
(7)
Eqn. 7 relates the fundamental parameters of Marcus theory,
the energy, e and reorganization
energy, l, to the activation
energy. If we consider a classical
theory such as the Arrhenius theory for the rate constant
we would have,
![]()
(8)
If
we consider the quantum mechanical model for the rate constant,
![]()
we can
write
![]()
(9)
where the
normalized Gaussian,
![]()
(10)
is the Franck-Condon factor. The functional form of the ET rate constant
has an electronic part, ![]() which
is related to the overlap of the donor and acceptor wave functions, and a
nuclear part, which depends on how closely matched e and l are. The electronic part has an exponential
dependence on distance, which comes from the exponential decay of the wave
functions as represented in Figure 4.
which
is related to the overlap of the donor and acceptor wave functions, and a
nuclear part, which depends on how closely matched e and l are. The electronic part has an exponential
dependence on distance, which comes from the exponential decay of the wave
functions as represented in Figure 4. ![]() is the non-radiative
analog of
is the non-radiative
analog of ![]() ,
the square of the transition moment. For
light-driven processes the coupling is induced by the
radiation field. For electron transfer
(atom transfer etc.) the coupling is proportional to the overlap of the donor
and acceptor wave functions. Speaking more precisely, the overlap is
proportional to the reactant and product wave functions, but we can consider,
for example, the overlap of the HOMO of the donor, D, and LUMO of the acceptor,
A, in a charge separation process
,
the square of the transition moment. For
light-driven processes the coupling is induced by the
radiation field. For electron transfer
(atom transfer etc.) the coupling is proportional to the overlap of the donor
and acceptor wave functions. Speaking more precisely, the overlap is
proportional to the reactant and product wave functions, but we can consider,
for example, the overlap of the HOMO of the donor, D, and LUMO of the acceptor,
A, in a charge separation process
![]()
Since effectively that is the overlap of ![]() with
with
![]() . This is illustrated
schematically in Figure 4, from which it is clear that the overlap decreases
exponentially with distance. Thus, we
can write,
. This is illustrated
schematically in Figure 4, from which it is clear that the overlap decreases
exponentially with distance. Thus, we
can write,
![]()
Where R is the internuclear
distance and ![]() depends on the details of the medium between
the donor and acceptor. As general rule it is thought that
depends on the details of the medium between
the donor and acceptor. As general rule it is thought that
![]()
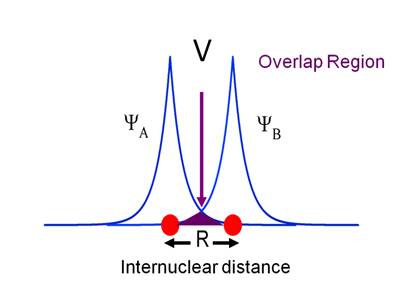
Figure
4 Depiction of the overlap of electron wave functions
that leads to electronic coupling.
Figure 3B shows that the different barrier
heights or activation energies, ![]() ,
as a function of e and l.
When e = l, then
,
as a function of e and l.
When e = l, then ![]() =
0, and the rate is maximum. This regime is called
activationless. It is clearly desirable
for forward electron transfers. However,
the Marcus equation also shows us how the RC can prevent undesirable charge
recombination from occurring. This can be accomplished by detuning e and l, so that
=
0, and the rate is maximum. This regime is called
activationless. It is clearly desirable
for forward electron transfers. However,
the Marcus equation also shows us how the RC can prevent undesirable charge
recombination from occurring. This can be accomplished by detuning e and l, so that ![]() is
large for reverse electron transfer.
is
large for reverse electron transfer.
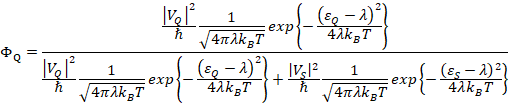
The quantum yield for photosynthetic electron transfer
For each
step in a series of electron transfer reactions, there is a quantum yield for
the forward (productive) electron transfer process,
![]()
where kf
is the forward rate constant and kr is the
reverse ET rate constant. The objective
of efficient capture of solar energy will be achieved
if this quantum yield can be maximized.
We can
examine the example of the reaction
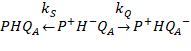
Where kQ is the
productive forward electron transfer that creates the ![]() state and kS is an undesirable back
electron transfer that wastes the light energy by returning to the original
state without doing any useful work. In
this case, it is relatively straightforward to explain the efficiency of the
forward charge separation process relative to the reverse reaction that leads
to the ground state. We need to have an
estimate of the reorganization energy for these processes. The reorganization energy, l, is a measure of the displacement of the
potential surface of the excited state.
In fact, we can relate it to S and say that
state and kS is an undesirable back
electron transfer that wastes the light energy by returning to the original
state without doing any useful work. In
this case, it is relatively straightforward to explain the efficiency of the
forward charge separation process relative to the reverse reaction that leads
to the ground state. We need to have an
estimate of the reorganization energy for these processes. The reorganization energy, l, is a measure of the displacement of the
potential surface of the excited state.
In fact, we can relate it to S and say that
![]()
For one mode or
![]()
If many modes are coupled to the electron transfer
process. It is the
reorganization of the protein around the active donors and acceptors in Figure 1
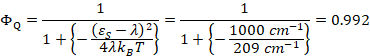
that contribute here. Experiments
have shown that the forward process ![]() is optimized, which
means that it is near the peak of the Marcus curve shown in Figure 5. The driving force
is, e = 4000 cm-1 and the
reorganization is nearly perfectly matched at l
= 4000 cm-1. Thus, e*
is optimized, which
means that it is near the peak of the Marcus curve shown in Figure 5. The driving force
is, e = 4000 cm-1 and the
reorganization is nearly perfectly matched at l
= 4000 cm-1. Thus, e* ![]() 0 for this process.
Given that the rate constant is approximately 1010 s-1,
we can calculate that
0 for this process.
Given that the rate constant is approximately 1010 s-1,
we can calculate that
![]()
as shown in Appendix C. Thus, the forward reaction is activationless and has significant electronic
coupling. This idea of a maximum rate
constant is shown in Figure 5. Figure 5 also shows that the the rate constant decreases when e > l. This is known as the inverted region.
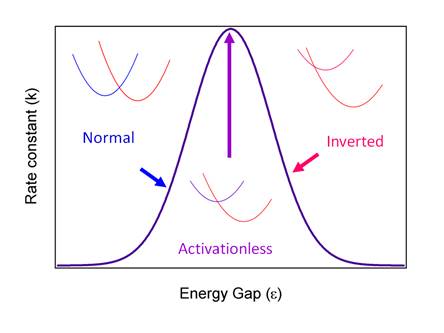
Figure
5. Plot of the Marcus theory regimes of normal, activationless
and inverted.
For many years scientists tried to prove that the inverted region existed. In fact, there is now little doubt that the
rate constant decreases as the driving force increases. After many years
Marcus wrote a paper pointing out the plot in Figure 5 looks like an absorption
spectrum. Since the Hamiltonian is not
an interaction with radiation, but rather a non-radiative process
involving coupling of states through overlap, the electronic parts
differ, but the nuclear parts are the same.
You should think of Figure 5 as a “spectrum”, but it is the
non-radiative “spectrum”. Any given
molecule can have only one e and one l, and those values determine where the
molecule resides on the curve in Figure 5.
We now turn our attention to the electron transfer reactions in
bacterial photosynthesis shown in Figure 1.
The distance from H to QA is
actually closer than the distance from H to the special pair, P. However, we know that P is
strongly coupled to H because of the very efficiency forward
process. For our simply consideration of
how the protein may control the electron transfer process we will simply assume
that the two electronic couplings are about the same
![]()
Given this simple assumption we
might expect that the rate constants would similar in magnitude. If this were the case
the quantum yield for forward electron transfer would around 0.5, which is not
very good for efficient charge separation.
The point here is that control over charge separation efficiency can be made at the level of the FC factor. In this case, the driving force for back
electron transfer is large, e ![]() 8000 cm-1. While we might expect that large driving
force to result in a fact rate (larger rate constant), we must remember that
the Marcus theory shows that large driving forces actually reduce the FC factor
since they are no longer activationless. The increase in e does not mean that l is
larger too, and in fact all of the evidence would
suggest that l is smaller for the reverse electron transfer process. However, once again to simplify the analysis
we will assume,
8000 cm-1. While we might expect that large driving
force to result in a fact rate (larger rate constant), we must remember that
the Marcus theory shows that large driving forces actually reduce the FC factor
since they are no longer activationless. The increase in e does not mean that l is
larger too, and in fact all of the evidence would
suggest that l is smaller for the reverse electron transfer process. However, once again to simplify the analysis
we will assume,
![]()
Thus, here the reverse electron transfer process, ![]() ,
has
,
has
![]()
Here we see that the activation energy is significant, and
therefore the FC factor will be much smaller for KS then for kQ.
Finally, we calculate the quantum yield for the forward process, kQ shown in Figure 2,
![]()
But, of
course, the prefactors are all equal by our
simplifying assumptions. Moreover, eQ* = 0. Therefore, the cancellations yield,
The quantum yield for forward electron transfer to the quinone, QA is greater than 99%. The control of
the direction of the flow of electrons occurs mainly because of the balance of
nuclear reorganization and driving force (free energy change) of the electron
transfer reactions.
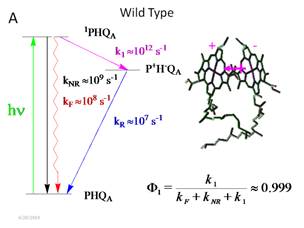
The quantum yield for the primary charge separation
step
Although the
primary charge separation step is the most important process in the RC, it is
also the most difficult to understand and to rationalize. The light energy captured by the special pair
of bacteriochlorophylls (BChls), known as P, is
converted into the ![]() excited state in about 1
ps at cryogenic temperature (even < 4K)! In fact, the rate constant for the
process increases with temperature. This
increase is predicted by Marcus theory. An activationless process, e* = 0 has only the prefactor
and so it is predicted to depend on temperature as,
excited state in about 1
ps at cryogenic temperature (even < 4K)! In fact, the rate constant for the
process increases with temperature. This
increase is predicted by Marcus theory. An activationless process, e* = 0 has only the prefactor
and so it is predicted to depend on temperature as,
![]()
It turns out that this is not really the hard part to
understand. Rather it is the high
quantum yield and directionality of the charge transfer that has caused many
years of research. The process and rate
scheme are shown in Figure 1.
The driving force for the primary charge
separation is very small. It is
estimated to be about e = 1000 cm-1. Given the preceding discussion we would
expect that the rate would not be at the maximum of the Marcus curve, unless l = 1000 cm-1 as well. We saw in the previous section that l = 4000 cm-1 is a more typical number for an
electron transfer reaction in a protein.
In aqueous solution where water molecules can reorient around the
charges, even larger values are observed (e.g. l
= 8000 cm-1). Somehow, the
special pair permits electron transfer to occur in a concerted manner that has
very low effective solvent reorganization energy. Perhaps part of the trick lies in the
absorption process itself.
When P is excited it has a large excited state dipole moment. This is created instantly and is inherent in the absorption
process. The dipole moment of P must
actually contain a significant reorganization, but this reorganization is “paid
for” by the light energy and not by the transferring electron. You can think of this as the creation of some
amount of ![]() during absorption. This partial charge separation “pushes” the
electron along the reaction coordinate that leads to
during absorption. This partial charge separation “pushes” the
electron along the reaction coordinate that leads to![]() . At this you might
think that the best way to capture light energy, and move an electron would be
to go all the way and make a charge transfer absorption process. P stops short of this. The reason is that charge transfer absorption
bands have rapid relaxation that leads to rapid dephasing and non-radiative
decay back to the ground state. As
Figure 6 shows, the non-radiative decay within P can also reduce the quantum
yield. Thus, P is a finely tuned
electron transfer machine that has just enough charge separation to push the
electron on the path towards H, but not so much that it destroys the efficiency
of charge separation.
. At this you might
think that the best way to capture light energy, and move an electron would be
to go all the way and make a charge transfer absorption process. P stops short of this. The reason is that charge transfer absorption
bands have rapid relaxation that leads to rapid dephasing and non-radiative
decay back to the ground state. As
Figure 6 shows, the non-radiative decay within P can also reduce the quantum
yield. Thus, P is a finely tuned
electron transfer machine that has just enough charge separation to push the
electron on the path towards H, but not so much that it destroys the efficiency
of charge separation.
We can prove
this by comparing the efficiency of P, a dimer, with the heterodimer
mutant. In the heterodimer, shown in
Figure 6, one of the Mg atoms of the chlorophyll does not insert during
folding. Thus, instead of P with two BChls, the RC has b,
which has one BChl and BPheo. The consequence of this is that the
absorption band is almost a pure charge transfer band, ![]() . The consequence is that non-radiative decay
is much greater and electron transfer slows down as well. The net effect is that the quantum yield for
primary separation drops from nearly 100% to 50%.
. The consequence is that non-radiative decay
is much greater and electron transfer slows down as well. The net effect is that the quantum yield for
primary separation drops from nearly 100% to 50%.
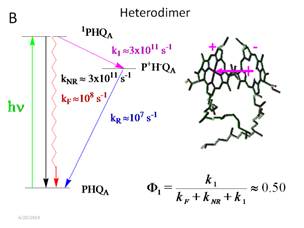
Figure
6. Kinetic scheme for the primary charge separation reaction.
The unique absorption of light energy in the photosynthetic RC
In the
previous section we have suggested that a dimer of BChl molecules has the ability to absorb light and create a
partial charge separated state. This has been measured by electric field effect
spectroscopy. If assume that the dipole
moment in the ground state is 0 by symmetry (see Figure 1, which shows the
symmetry of the RC), we can understand that there is symmetry breaking in the
excited state if the ![]() state is created so that the electron is one
side of the RC. The measurement suggests
that the dipole moment in the excited state
state is created so that the electron is one
side of the RC. The measurement suggests
that the dipole moment in the excited state
![]()
is ~7 Debye. This relatively large dipole moment indicates
that the special pair has partial charge separation. The coordinate s
can be x, y, or z and depends on the coordinate system.
This large
charge separation implies that the nuclei have a large displacement in the
excited state. This can
be understood since large charge displacement requires a significant
change in the bonding electronic structure.
The nuclear displacement along certain key vibrational modes that
involve the dimer should be significant.
These displacements have been measured by Raman
scattering. The result is shown in Figure 7.
The net effect is that the electron-vibration coupling, S, is large for P relative to B or H. This can actually be seen
directly in the absorption spectrum, also shown in Figure 7. The absorption band for P is
shifted and broadened, which indicates that it has a different FC
progression. Quantitative information on
the magnitude of the shift in the excited state surface can
be obtained from the intensity of the Raman bands. Figure 7 shows that there are several low
frequency Raman bands observed when the excitation laser is tuned into
resonance with P, that are not observed when the laser is in resonance with the
BChl monomers, B.
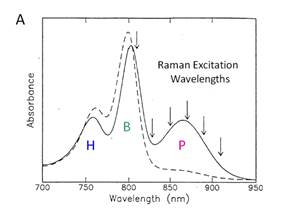
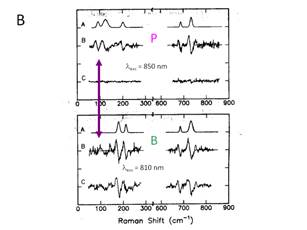
Figure 7. Absorption and resonance Raman data for the chromophores
of the bacterial RC isolated from Rsp. Sphaeroides. A. The
absorption spectra for the three chromophores, the BChl
dimer P, the two BChl monomers, B, and the BPheo, H are shown. B. The resonance Raman spectra obtained using
a special method to observe small Raman bands on a large fluorescent background
is shown.
The FC progression depends on the form of the nuclear overlap
factors, which we have seen is
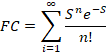
For a single mode.
Suppose that many modes are coupled to a reaction. Then the FC factor is the product of those
single mode factors, i.e.
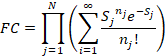
where each mode has its own electron
vibration coupling constant Sj. The Raman results suggested that for P, there
is an important 30 cm-1 vibrational mode with a large Sj. This
mode could be an intradimer stretching mode. Obviously, this mode is absent in a
monomer. This coupling may lead to the
observed absorption band of P and this may in turn be
connected to the excited state nuclear displacement observed by electric
field effect spectroscopy. These
speculations are supported by a number of experimental
observables that are beyond the scope of this course. However, the example of photosynthesis
provides a window into the manner that biophysics is applied to the study of
important biological problems such as the capture of the Sun’s energy by plants
and bacteria, which is the origin of all life on the planet.